Examples · SaaS product demos
Guide a buyer from dashboard to retention insight
A focused analytics walkthrough that opens with context, directs attention to one cohort, and ends on a useful product insight.
Interactive walkthrough
Illustrative exampleUse the Previous and Next buttons, activate the hotspot, or press the left and right arrow keys to move through this three-step illustrative example.
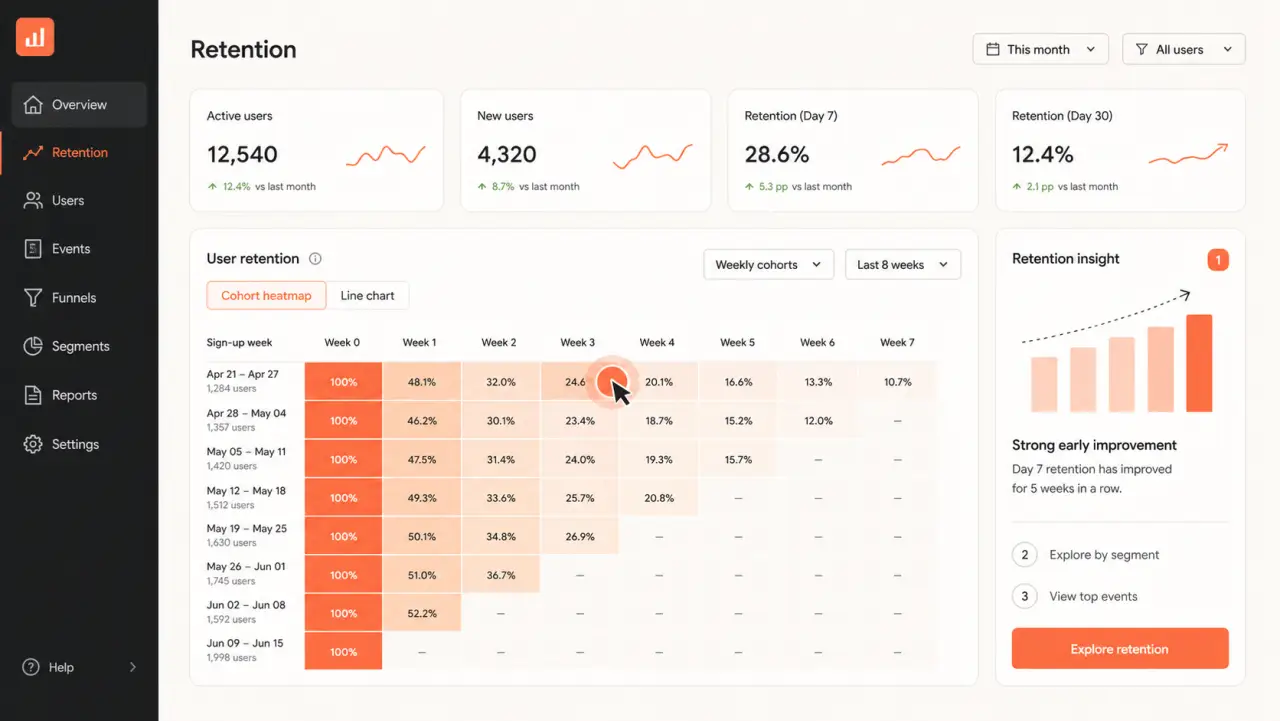
Step 1 of 3
Current step
Orient the viewer
Start on the retention overview and explain the question this workflow will answer.
Three-step walkthrough
-
Orient the viewer
Start on the retention overview and explain the question this workflow will answer.
-
Focus on one cohort
Use the hotspot to direct attention to the week where the retention pattern becomes visible.
-
Close on the insight
Connect the chart to the visible retention summary and give the viewer a clear next action.
Why it works
Keep the experience tied to one useful outcome
- 01The opening step states the analytical question before asking for a click.
- 02Each interaction narrows attention instead of touring every dashboard control.
- 03The final step translates the visual pattern into a decision-ready takeaway.
DemoFast features used
A lightweight build, not a simulated integration
Clickable hotspots
Text guidance
Shareable link
Implementation guidance
Build the real version from approved product screens
- 01
Choose one dashboard question that matters to the intended buyer.
- 02
Capture only the screens needed to reach the evidence.
- 03
Place markers on stable interface controls and keep annotations outcome focused.